“RAS-Flood” Basic Methodology
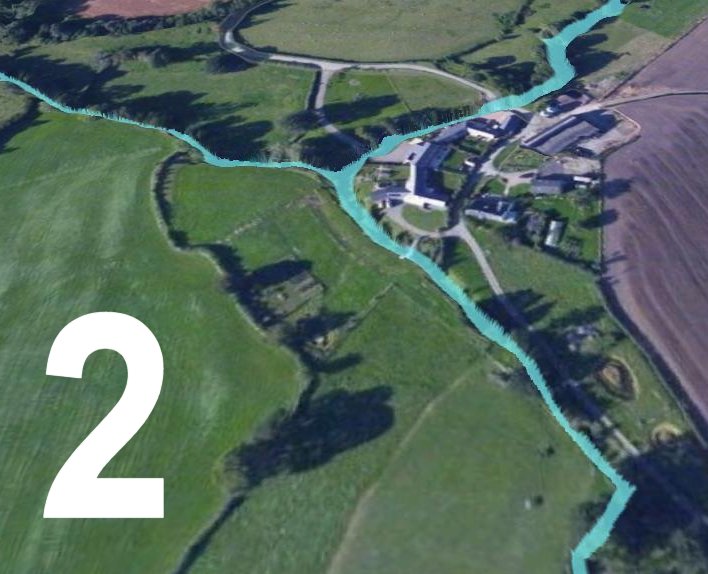
1. GIS narrative

The relief of the watershed (here a 40 km2 Severn valley tributary) is analysed and layered in respect of drainage area and flow accumulation.
2. Smooth bathymetry overlay
Stream bathymetry from the “Stage 1” 1M lidar point-cloud is developed for flow continuity (Atrepo point-smoothing methodology).
3. Mesh and Flow RAS computation
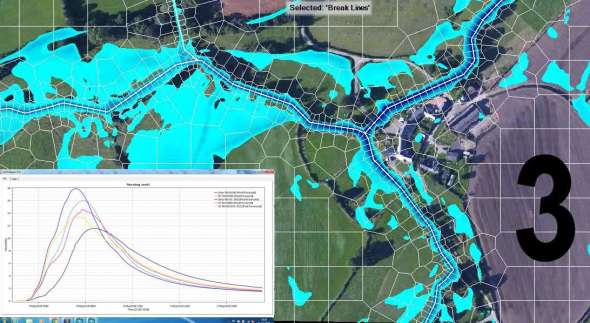
A computation mesh is developed for flow analysis (RAS 2D code courtesy USACE). Increasing levels of upstream intervention are tested for impact on the downstream hydrograph. The most attenuated hydrograph of above illustration “3” is indicative of the ‘multi-measure’ effect of ambitious (five measures per km2) course adaptations within the watershed perimeter of illustration “1”. Such adaptation is sometimes described generically as ‘Slow-the-Flow’. In ‘RAS-Flood’ virtual case-study, watercourses are constrained routinely at infrastructure-crossings and other optimal locations to boost riparian blue-green storage – this for community benefit, always assuming consent and with overbank ‘ponding’ of limited duration and only under extreme rainfall. More . . .
From Risk-Assessment to Action-Plan.
“A useful tool for any catchment study !!”
RAS-Flood is available to run under ‘Remote-Desktop’ or ‘Team-Viewer’ on request. Calibration event for the flow modelling exercise reported here is the 25mm Mid-Wales rainfall from 06.30-07.30 am on 27 May 2018.
What is RAS-Flood More on Virtual Case Studies Acknowledgements
———————————————————-
![]()
