‘RAS-Flood’ Stream Network Analysis
Posted: September 15, 2018 Filed under: Uncategorized 1 CommentCatchment Solutions
Rainfall >> “RAS-Flood” >> Hydrographs

(Conference presentation poster 2018)
“RAS-Flood” : A useful engineering tool for quantifying the beneficial downstream impact of upstream channel intervention – such hydraulic analysis to complement routine risk assessment where extreme flow crossing riparian boundaries (ie from catchment to channel) is likely to exceed downstream conveyance capacity.
More on RAS-Flood . . . . Acknowledgements
Welcome Hec-Ras 5.0.7
Posted: May 10, 2018 Filed under: Uncategorized 2 Comments
- Further USACE update; another step in a good direction for Stream Network (Catchment Process) Analysis
- ‘5.0.7’ enhances sub-catchment RAS-Flood approach to spatially-variable-rain-on-2Dmesh
- Open source code: just add lidar & rainfall to quantify FRM opportunity
- Not least, Atrepo’s 1000 km2 Upper Severn project (below) is more responsive


In the meantime, also :
- improved slope transfer across cells
- more versatile 2D to 2D connection
- Defra benchmarking
- effective macro-opportunity-mapping by roughness control
![]()
- So roll on 2020 and spatially variable whole catchment rainfall
Acknowledgements – ‘ALFA’ courtesy EU/NERC – ATREPO (in-house)
Flood Alleviation by Catchment Process
Posted: July 11, 2017 Filed under: Uncategorized Leave a comment.
“EVERY RURAL sq km CAN CONTRIBUTE to FRM”
There is currently an increased interest in ‘Blue-Green‘ flood storage and the redress of loss by Catchment Process. Such FRM strategy explores not only consideration of risk but also the equitable redistribution of extreme event flooding. This article describes an approach to flood alleviation – based on the innovative mapping and numerical analysis of 2km2, 40km2 and 1000km2 catchments in Lancashire and Mid Wales – which is capable of extrapolation to any catchment or stream network. Numerical models of catchment hydraulic process demand hourly rainfall archive. As historic data are released, calibration to historical time-series promises to yield useful methodology and to encourage catchment engineering – where appropriate by Ecosystem mechanism – for the benefit of stakeholders. In particular, the article is in support of Upper Severn (EA area 59) & Upper Irwell (EA area 30) partnership ambition where there is, without doubt, no lack of opportunity for beneficial intervention by Floodplain development, Run-off Attenuation (RAF’s), and Catchment-wide adaptive land-use.
SYNOPSIS
The essential roles of rainfall data and of temporary flood storage at the upland perimeter of catchments are discussed. The methodology of diffuse ponding and the communication of such strategy to stakeholders is considered: further the significance of ‘leaky’ (blue-green) ponds below 10,000m3 cubic capacity is explored. The background to the problem of impact distribution, highlighted by Storm Desmond in December 2015, is argued alongside fundamental flood defence strategy. Reference is made that Community authorities have a duty to share resources for FRM. Finally, to put technical flesh on the bones of the approach (and marked new below), method and parameterization of opportunity mapping, flood water detention (by chains of features), and hydraulic modelling of downstream-stage from rain-on-grid are presented. Taking account of 2016 DEFRA competitive tender for NFM innovation, particular reference is made to the river systems draining to Carlisle and the aspirations of the Carlisle Floods Partnership.
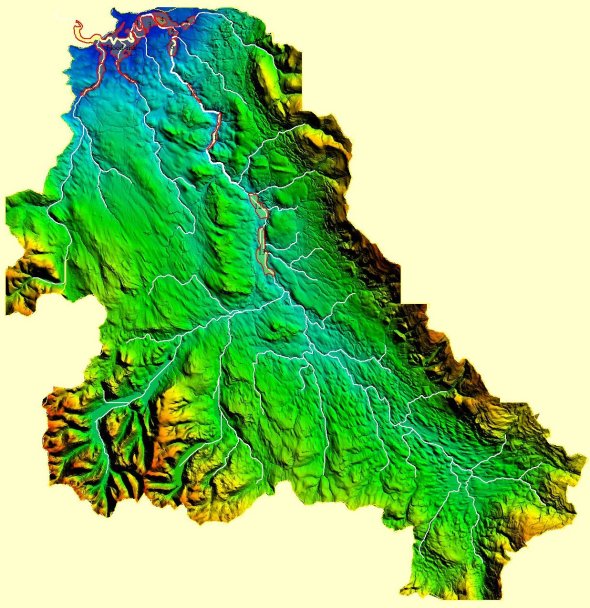
Figure 1: The primary river system pouring to Carlisle within cropped relief. In this notorious catchment, a budget average of 10,000 M3 per km2 would accommodate the 18,000,000 M3 overspill now associated with loss in recent years – ‘no-constraints’ intervention, sympathetic to concentration times, being considered initially at the perimeter of catchments.
1. “HOURLY RAINFALL DATA – ESSENTIAL FOR CATCHMENT ANALYSIS”
The primary parameters of catchment process are elevation, terrain roughness and hourly local rainfall. The progress of mobile technology promises mapping tools to identify on site ‘hot-spots’ not only of rural pollution but also rainfall detention. 2D numerical analysis takes advantage of distributed datasets thereby reducing reliance on imposed 1D equations (of simulated canalization, weirs and storage) which are difficult for stakeholders to understand. Diffuse managed ponding (eg Fig 2), riparian amenity features and corridors of dense vegetation (Fig 4) are useful tools for controlling downstream flow. Communication and good understanding underpin delivery of risk-gain in areas of diverse stake-holding and ownership. The emergence of open source analysis code alongside automated harvesting of data has created new opportunities for testing solutions and engaging public interest.

Fig 2: Engineered (c. 7000m3) temporary storage pond draining to Lac du Bourdon, (Loire Valley, France, Aug 2016 )
2. “LEAD AUTHORITIES HAVE A DUTY TO CARE AND SHARE [data]”
Under the Flood and Water Management Act 2010, risk management authorities have a duty to co-operate and to share data. A key theme of the Pitt Review was for flood risk management authorities to work in partnership to deliver better flood risk management for the benefit of communities. However Catchment Process can fall between the Environment Agency’s focus on main-rivers, and LA focus on surface water flooding (ie from urban built environment). In practice partnerships seldom lead or have funds to deliver significant flood alleviation.
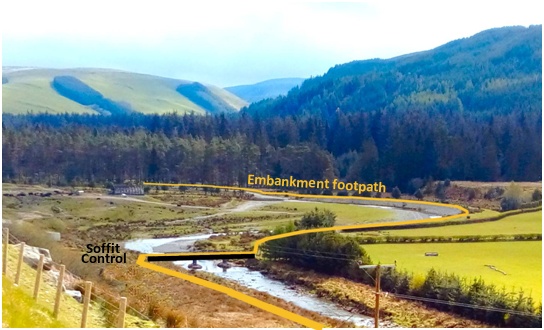
Fig 3 : Mid Wales amenity with blue-green storage potential upstream of the footbridge (May 2017)
3. “SOLUTION BY BOTH FORM AND ROUGHNESS”
Flood Management is effectively dynamic control of water: The two primary levers of shallow water hydraulic control are roughness and elevation (form). In traditional analysis of such hydraulic flow, elevation (and slope) assign force to flood flow, with resistance (roughness) adjusted supportively to achieve solution (of analysis) and calibration. Whilst both parameters are ‘given’ by our natural environment, for strategic built schemes, it is more usually form which is developed for community and private resilience (levees, dams, structures, etc). But is it defendable to focus FRM on this expensive (built, smooth and often ugly) ‘form-based’ approach, when the natural sibling ‘roughness’, so often FRM’s Cinderella, is delegated to a mere reactive role? Roughness is easily modelled and grows naturally. It produces not only useful (albeit porous) capital assets, but also puts down roots to achieve self-maintenance. Roughness can be cropped for food and energy. Whilst it has to be managed for good control, it does not have to be built.

Fig 4 : Rhizome hedge (Fougeres, France) appropriate for deployment across flood plains to soften hydrograph peaks by enhancing blue-green storage (April 2017)
4. “CATCHMENT PROCESS CAN AUGMENT CHANNEL DEFENCE”
If downstream discharge (of floodwater) and built defences are at a limit, high value flood-risk-loss can be moderated by distributing ‘blue-green‘ storage more benignly starting upstream, not least to provide amenity (Fig 3). In the case of Carlisle, capacity west of the M6 has been shown to be beyond breaking-point promoting consideration of rural areas for attenuation augment (ie to the East and South of the M6 crossing ). Bearing in mind that large-scale barriers (such as the Leigh) are engineered to a higher standard than modest ‘diffuse’ storage ponds (ie storage less than 10,000m3), a reasonable budget for distributed detention can be set out, for example as Table 1 below, to bring the Environment Agency’s target of 18Mm3 for the Eden catchment within reach.
| Storage | Mm3 | Budget | £ M | Comment with reference links |
| Rural Reservoir | 2.6 | £5/m3 | £13 | Engineered Storage with control; (Leigh 2Mm3 budget being £10M) |
| Rural Ponds | 12 | £0.5/m3 | £ 6 | as detention chains |
| Rural Floodplain | 4 | £0.25/m3 | £ 1 | High-friction 40 km2 floodplains 0.1m temporarily deeper |
| Rural Total | 18 | £20 | 18Mm3 = 2015 Carlisle overspill | |
| Urban Repair | – | £5 | Tidy up gaps in 0.5% AEP provision | |
| TOTAL | 18 | £25 | Carlisle’s share of Cumbria budget |
Table 1: An Eden budget with attenuation distributed by Catchment Process
[Author’s note: 18Mm3 Carlisle flood relief relates approximately to a downstream reduction of some 10% by discharge and 7% by stage, and to flows under the M6 greater than 1300 m³/s. Additional catchment storage always being assessed holistically in terms of both medium and extreme event concentration times.]
[Author’s note: 18Mm3 Carlisle flood relief relates approximately to a downstream reduction of some 10% by discharge and 7% by stage, and to flows under the M6 greater than 1300 m³/s. Additional catchment storage always being assessed holistically in terms of both medium and extreme event concentration times.]
5. “HYDRAULIC SOFTWARE OPPORTUNITY-MAPPING LOCATES ‘BLUE-GREEN’ STORAGE AREAS WITH DEVELOPMENT POTENTIAL”
A NEW submission for Defra’s 2017 competition
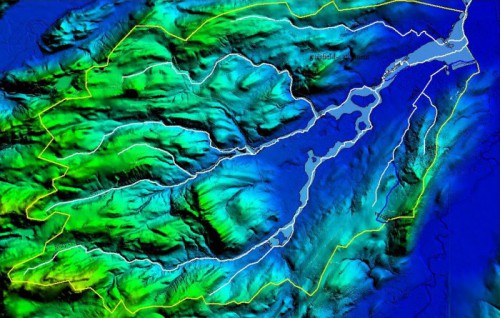
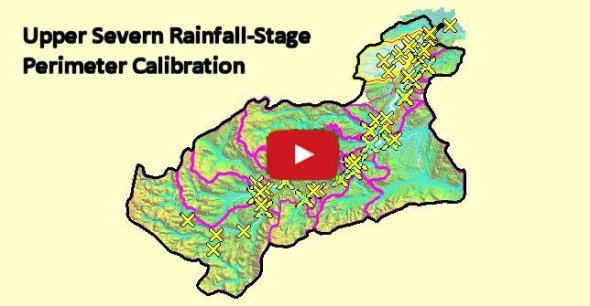
In broad terms, intense rainfall is applied to synthetically ‘hyper-rough’ terrain to create an ‘extreme’ inundation perimeter. This perimeter effectively maps potentially useful green storage ‘hotspots’ capable of development on the ground. There is evidence from pilot study that chains of such attenuation features (developed primarily in roughness but also in form) diffuse downstream stage peaks. 2D analysis under historic hourly rainfall of terrain with alternative distribution of ‘competing’ detention ponds can then compare the benign effect downstream. Figs 5 & 6 below (grid SO2397) show relief overlayed with the (purple) inundation perimeter of extreme hydraulic analysis marked up with (yellow) green-storage opportunity ‘hotspots’, (ie locations for ‘Leaky’ ponds which fall below the 10,000m3 ceiling of reservoir legislation).
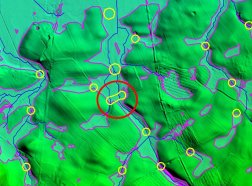
Figs 5 & 6 (above) show green storage opportunity mapped under extreme inundation
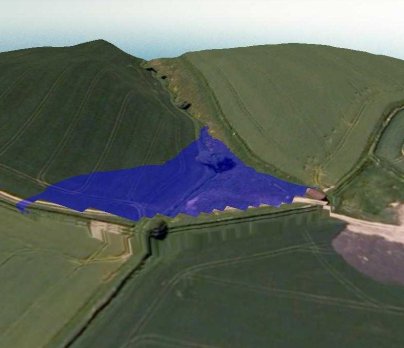
Fig 7: (SO2397 AP40 marked-up) shows green storage development of the location highlighted in red
The location ringed red in Figs 5 & 6 is ground-truthed in Fig 7 as a potentially helpful pond of approximately 3000m3. In this 20 km2 area alone there are interesting locations for some 30 ponds. Once the software has mapped locations of green-storage potential, historic rainfall (hourly data being available) can be applied to alternative land-cover until the desired stage reduction is achieved. Fig 8 below (approx. 1 sq km tile SJ2212) shows a typical variable grid and a snapshot (Fig 9) of the stream network as the flow increases under catchment rain-on-grid.
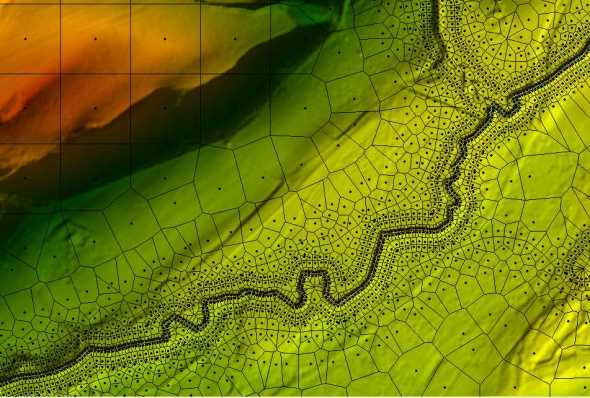
Figure 8 (Grid) & Figure 9 (Flow) illustrate 40km2 Mid Wales 2D pilot model
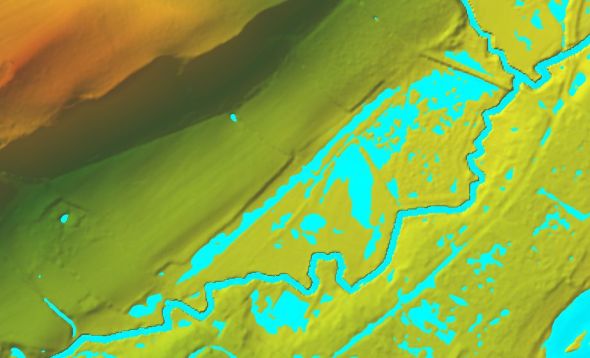
Fig 9: Tile SJ2212 snapshot as flow increases.
An animation screen-grab (Figure 10 below) illustrates the flow mid reach of a 1000 km2 Upper Severn 2D model similar in many respects to the Eden catchment. With a variable 10/100m computation grid (ie generally as Fig 8 above), the shallow water equations of this larger catchment solve in approximately 90 minutes.
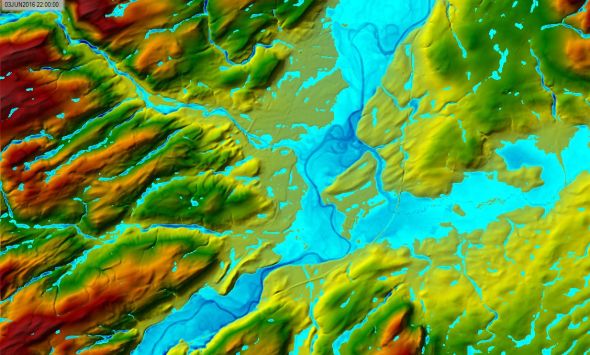
Fig 10: Mid reach section of Upper Severn 1000km2 model showing a screen-grab rain-on-grid flow animation.
This larger 1000km2 catchment has been tested (Fig 10) under open source code with open lidar form, synthetic roughness and synthetic rainfall. In the longer term, given data and reasonable coordination, opportunity exists for every catchment in the country to be subjected to indicative analysis of this nature at low cost. [Author’s note: It would be helpful also to run such simulation with alternative 2D code to establish a standard nationwide template of analysis].
6. “THE DEFRA CARLISLE MODELLING COMPETITION in 2016 HAS ADDED MOMENTUM TO SOLUTION BY NFM”
The published Carlisle Flood Investigation Report (compiled by CH2M and precised here) states “Carlisle is at the confluence of three major rivers, the Rivers Eden, Caldew and Petteril, and is therefore highly prone to flooding . . . events in 2005, 2009 and 2015 were driven by all three rivers . . . there was also an event in June 2012 . . . current flood defences are designed to reduce the flood risk for an event with a 0.5% probability of flooding occurring in any one year . . . £25 million of £3bn funding has been earmarked to improve flood risk management in Carlisle” .
The 2016 competition launch presentations stated (here again in precis) that:- “In 2015, 18,000,000m3 ended up behind defences in Carlisle . . . The Eden is a diverse catchment in terms of geography, with communities affected from headwaters to lowlands . . . The EA usually model just river and flood plain, (ie once water is in the channel) but want now to build on this with catchment modelling to manage water both overland and in smaller tributaries. . . . . . . The Agency seeks wider integrated (CaBA), outcomes, including natural flood management with all catchment management groups represented. . . . Cumbria RFCC supports the Agency, Local Lead Authorities and CaBA Partnerships in tactical roles. . . . Natural and engineered solutions are needed with outputs assessed against different storm conditions”.
[Author’s Note: Reference was made to risk awareness, uncertainty, and the legacy of 1D numerical channel simulations. Advances in Open Data were hailed and new listings of catchment analysis tools introduced. There was little mention however of solutions derived from modelling. Whilst reference was made to ‘single, scalable assessment by open, and trusted software, download links to such code and data were not disclosed].
7. “ANALYSIS of RECENT CARLISLE FLOODING BEGS THE QUESTION”
“Why was a competition not launched in 2006 ?”.
Four Carlisle flood events in 10 years were described in terms of downstream historic channel AEP which, to public ears, is arguably misleading – even discredited. Forecast Catchment-Rain-on-Grid (ie the impact of 200+ mm rainfall on Black Moss, Greystoke and Skiddaw in the same 48 hour period and its modelled effect downstream) could be a better way of connecting cause and effect, not least for negotiation with upland landowners. From the CH2M Report, it would seem that, in respect of flooding, the built environment to the west of the M6 is unfit for purpose, even if it is considered possible to increase channel outflow. From Q&A at the competition launch event, it would appear also that little or none of the 2005-2015 spend was assigned to catchment (ie rather than channel) process. Reading the 2009 Eden CFMP, CaBA orientated Policy 6 is considered only for some 20% of the catchment with no evidence of ‘WwNP’ delivery. Furthermore there is no assessment of catchment reaches capable of Barrier-Storage, or indeed reference and quantification of Catchment-Process. Furthermore, access to national land-cover and hourly rainfall data is still restricted and undermines catchment analysis. Indeed this censorship caused a pilot (40 km2 Fig 11) catchment study to stall prior to up-scaling to Carlisle’s c. 2000 km2. The pilot study, supported by national flood-risk teams and by the Rivers Trust and deriving from a 2011 study of a reach of the Upper Severn, had been in progress for several months prior to the competition.Flood-risk-gain is a goal for ALL vulnerable communities (ie it is not just a goal for Cumbria).

Figure 11: The 40km2 Upper Severn pilot sub-catchment showing stream-network and floodplains
8. LIMITATIONS OF THE APPROACH.
Whilst open-source modelling utilities fit well alongside open-data for hydraulic analysis of catchments under diverse ownership and stake-holding, such code can be less versatile than commercial alternatives. In particular, for the exercises described above, it was not possible to input a moving storm to a 2D computational area. Before a national template is set out for productive 2D analysis, input and calibration data should be to hand so that grid resolution can be adjusted to give pragmatic run-times. Once a template is tested, a model can be set up for any catchment within a few days and run to test alternative outcomes within a few hours , even when large stream networks are loaded .
9. SUMMARY and CONCLUSION
The article is therefore
1. A technical precis of methodology to promote adaptive land-use for flood alleviation (EU acronym ‘ALFA’). A default budget of 10,000m3 ‘blue-green’ storage, modelled per km2 of catchment, is commended – ie, functional temporary floodwave diffusion for 1 day in every 10,000 days.
2. Evidence that restrictions on data distribution compromise the search for solution – which in turn risks increasing flood risk to vulnerable communities. Without calibration data, analysis is incomplete and, for stakeholders, unconvincing.
Thereafter, the problems to be overcome include
1. Poor sharing of archive data
2. Unbalanced investment in form over roughness
3. Unbalanced focus on risk awareness over engineered solution.
Significant proposals are
1. Open hourly rainfall historic archive to allow calibration and completion of catchment pilot projects nationwide
2. Genuine follow through of competition aspirations
3. Proactive focus on mechanisms to connect smart floodwater storage with agricultural productivity by improved land drainage.
![]()
Farming land for water
Posted: December 1, 2016 Filed under: Uncategorized Leave a commentClick here https://storify.com/GreenAllianceUK/farming-land-for-water

Catchment Process . . . .
Posted: November 26, 2016 Filed under: Uncategorized Leave a comment
. . . in action
Major rainfall event at #Holnicote on monday, #nfm structures holding in excess of 20,000m3 flood water, no cottages flooded in Bossington! pic.twitter.com/lZX22zhv4t
— PAA Ecology (@PAA_Ecology) November 25, 2016
Farmland used to store flood water and then steadily release it. Reduces pressure on towns downstream @waterlevels pic.twitter.com/gvD42QrhoU
— James Wright (@JPBWFarm) November 25, 2016
![]()
Towards a 2D x 1000 sq km Catchment Flood Alleviation Model of Adaptive Landuse
Posted: December 27, 2015 Filed under: Uncategorized 2 Comments
The animation shows primary Upper Severn tributaries and indicative 2D modelling of a 40km2 stream within the 1000km2 main river catchment perimeter. Presented also are the scope and goals of a Mid-Wales project, in association with River Trusts, to quantify the effect of both floodplain and landuse roughness on the depth and flow of extreme events. The map of c. Q80 mid-storm flood-depth is indicative of opportunity for c. Q40 porous (high roughness low impact RURAL) green storage.
40km2 Pilot Settings: 10/100m grid; applied synthetic 75mm x 24 hour rainfall; normal outflow; no infiltration; existing riparian features; baseline homogeneous non-strategic roughness.
Parameters of Opportunity (never forgetting the importance of benign lateral impact): Agri-roughness, infrastructure crossing adaptation, terrain-hillslope, stream-sinuosity (vector difference), soil moisture/permeability, coarse-fine rainfall-runoff analysis (as above); ; All towards a goal of remotely sensed hotspots sampled, ground-truthed and weighted.
(For full screen, press ‘play’ and left-click the lower RH corner of the animation)
![]()
(No video from server ?, then try this ‘Onedrive’ link )
Upper Severn ‘blue-green’ analysis – Q10 calibration 1Dec2015
Posted: December 15, 2015 Filed under: Uncategorized Leave a commentThis gallery of images records a 2015 survey of ‘Blue-Green’ (ALFA) potential in the Severn Uplands.
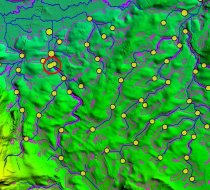
The approach is to map opportunity for green storage thereby to exploit CAP Pillar 2 incentive for community FRM investment in Adaptive Landuse (aka Ecosystem Service). Flood extent at some 50 points on the wet perimeter of a c. Q10 event is mapped following 35mm rainfall over 36 hours on 29/30 Nov 2015
Keywords:
SCIMAP, Atrepo, Alfa, Flooding, NFM, Opportunity mapping, Blue-Green
![]()
Acknowledgements – (‘ALFA’ acronym courtesy EU/NERC projects)
Agri-structure as Infrastructure
Posted: November 10, 2015 Filed under: Uncategorized Leave a commentFlood Alleviation Control by ‘Roughness’ as well as by ‘Form’
This article arises from a recent London Forum seminar and seeks to raise awareness of engineered landuse (‘roughness’ control) to mitigate the effects of extreme flooding. The approach was touched on by the ‘Local-Strategy’ panel, in particular by the NFU, but, despite questions from the audience, no financial framework was put forward to link the COST of such rural work with the flood alleviation BENEFIT accruing.
Flood Management is effectively dynamic control of water: the two primary levers of shallow water hydraulic control are elevation and roughness. In analysis of such hydraulic flow, elevation (and slope) assign force to flood flow, with resistance (roughness) adjusted supportively to achieve solution (of analysis) and calibration. Whilst both parameters are ‘given’ by our natural environment, for strategic/built schemes it is more usually the former which is developed for community and private resilience (levees, dams, structures, etc).
But is it defendable to focus FRM on this expensive (built, smooth and often ugly) ‘Form-based’ approach, when the natural sibling ‘Roughness’ is delegated to a mere reactive role? Roughness grows naturally. It forms not only usefully porous capital assets, but also puts down roots to achieve self-maintenance. Roughness can be cropped for food and energy. Whilst it has to be managed and dense for good control, it does not have to be built.
So argument here is in defence of ENGINEERED roughness both for community benefit and for resilience (when river conveyance becomes over-zealous as in flood); not forgetting that rivers are primarily conveyors of good water which for the most part is benign – good for both life support and wellbeing.
The November 2015 WEETF seminar certainly re-examined problems and priorities of flood management, and a few (NFU) slides did indeed illustrate the helpful role landuse can have in this respect. However the potential of the monetary mechanisms to exploit landuse good practice was not explored. In particular:-
- Inclusion of FRM works in RDP’s (& Glastir)
- CAP Pillar 2 definition of Flood Alleviation works as community development gain
- (Urban corridor) Insurance sponsorship as best practice
- Urban local authority sponsorship as best practice
- Water Supply Industry obligation (particularly of catchments resourcing urban clean water)
- The new Somerset Rivers Authority financial framework as good practice
- Drainage Board/District extension (to link green storage with managed rural drainage)
It would promote the several references to the multiple benefits of strategic vegetation (pollution control, wildlife corridor, flood alleviation, water quality, etc), if effective monetary mechanisms could be identified which link Rural Development COST with downstream community BENEFIT . For example, in many catchments, the inverse of the Somerset formula could be applicable, ie the concept/mechanism of ‘negative‘ levy (aka RDP grant) for landowners who deliver community FRM gain.
![]()

Flood Alleviation within Rural Development
Posted: January 8, 2015 Filed under: Uncategorized Leave a commentThis gallery of images records a 2014 survey of FRM/’ALFA’ potential along the rural England-Wales border. Evidence exists there of opportunities, primarily by attenuation, to exploit CAP Pillar 2 incentive for community FRM investment by Adaptive Landuse (Ecosystem Service). Approaching 100 locations of interest are identified. Such sites, when characterized, should be visible also to spatial targeting software.
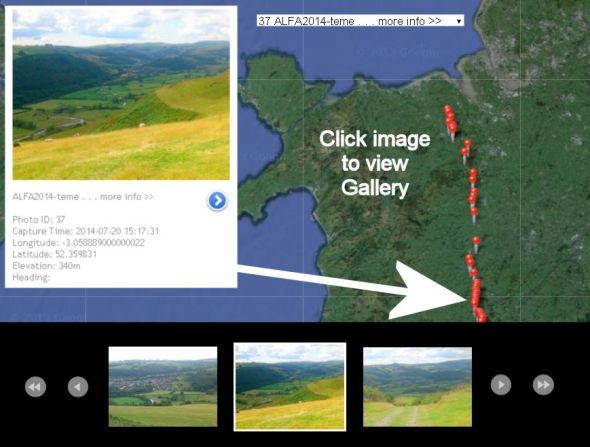
Character (photo-tag) updates are in progress by
- agristructure_opportunity (porous structural features)
- downstream_risk
- floodplain_opportunity
- green_storage
- infrastructure_opportunity
- landuse_risk
- pinch_point
- roughness_opportunity
Keywords:
SCIMAP, Atrepo, Offa, Alfa, Flooding, NFM, Opportunity mapping, Connectivity mapping, Risk Mapping
– – – – – – ‘ALFA’ acronym courtesy EU/NERC projects – – – – – –
(‘more info >>’ points currently to Atrepo archive)
test embed from box public